Scan Results, Findings & Retest
What to do once a scan finishes: reading the run, working through what it raised, proving each finding, deciding about it, and confirming a fix actually landed.
The scan detail view
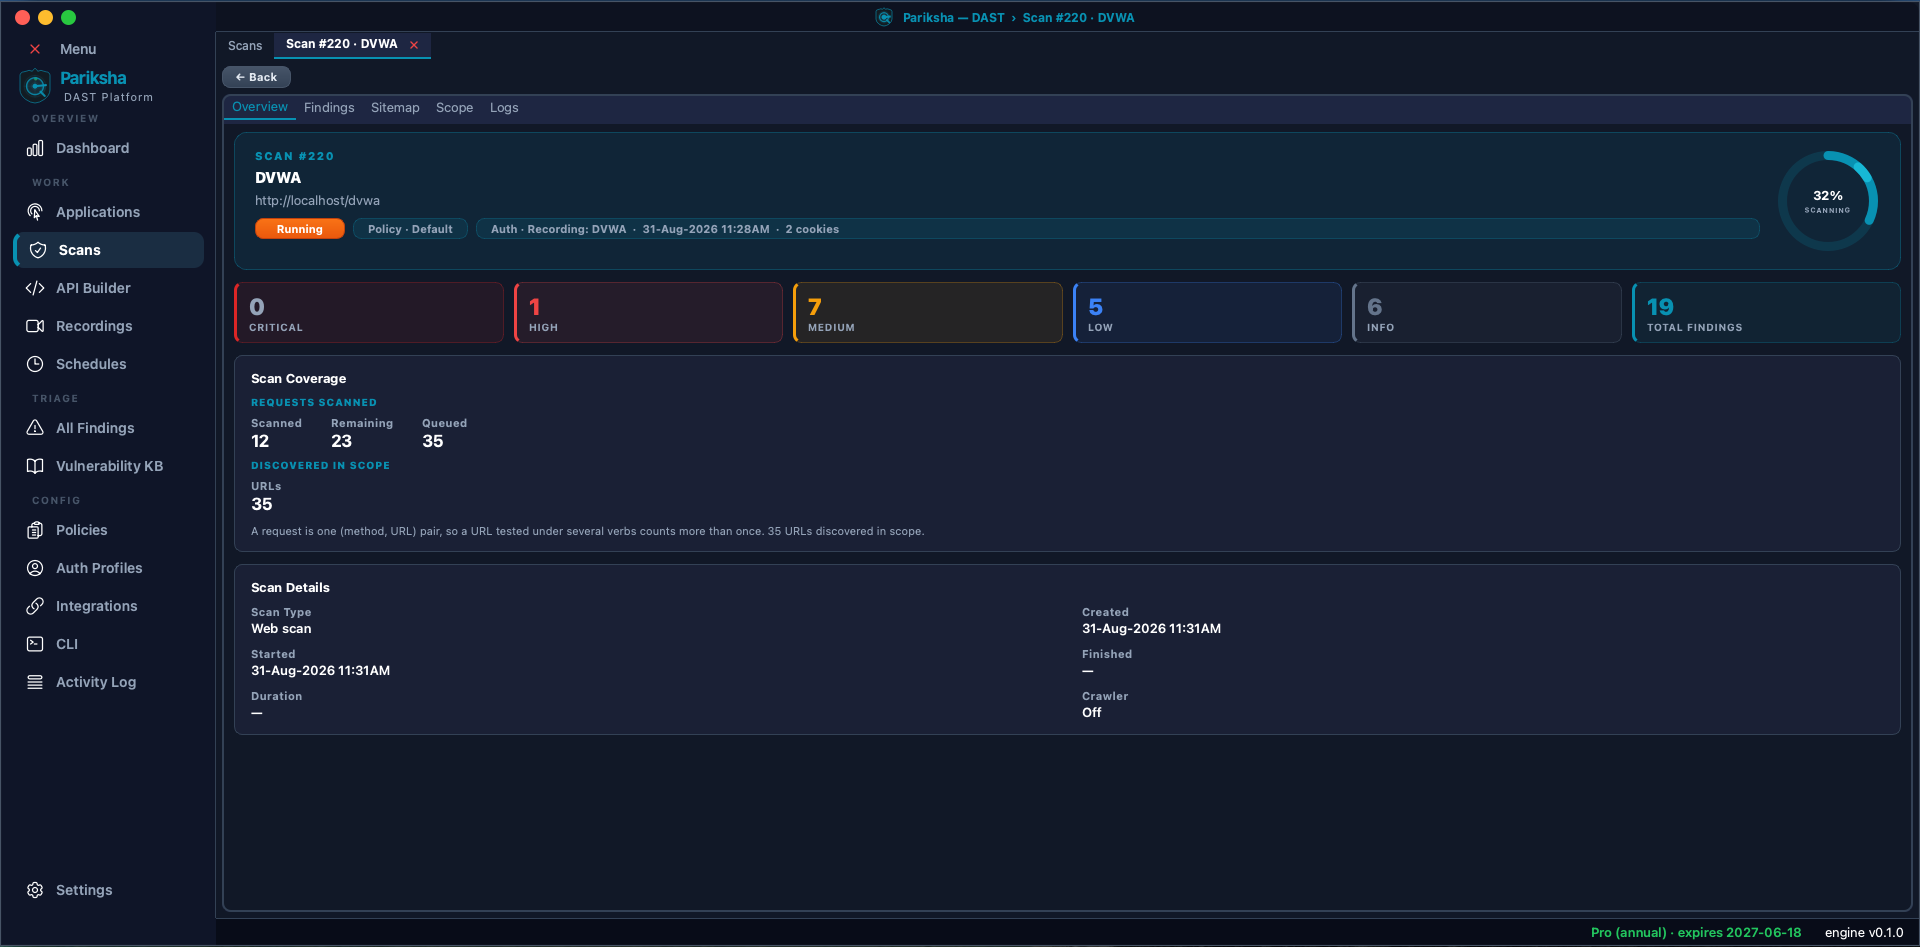
Every run opens into its own tab from the Scans list, with five views across the top and a Rescan button that repeats the run with the same configuration.
| Tab | What it shows |
|---|---|
| Overview | Severity tiles, total findings, scan coverage and run metadata — type, created, started, finished, duration, whether the crawler ran. |
| Findings | Everything the run raised, grouped by severity and type, with the full detail pane. |
| Sitemap | The surface the scanner actually reached. |
| Scope | The rules that governed what was in and out of scope for this run. |
| Logs | The run's own record — what to read when a result needs explaining. |
Severity tiles
Findings are counted into Critical, High, Medium, Low and Info, plus a total. Severity comes from the engine's vulnerability knowledge base and is adjusted by the confidence of the detection.
Scan coverage
Requests scanned, remaining and queued, plus the count of URLs discovered in scope. A request is one (method, URL) pair, so a URL tested under several verbs counts more than once — which is why the request count is usually higher than the URL count.
This panel is how you tell a scan that found little because the application is clean from one that found little because discovery never reached anything. If URLs discovered in scope is a handful on a large application, fix discovery and rescan rather than trusting the result.
Working through findings
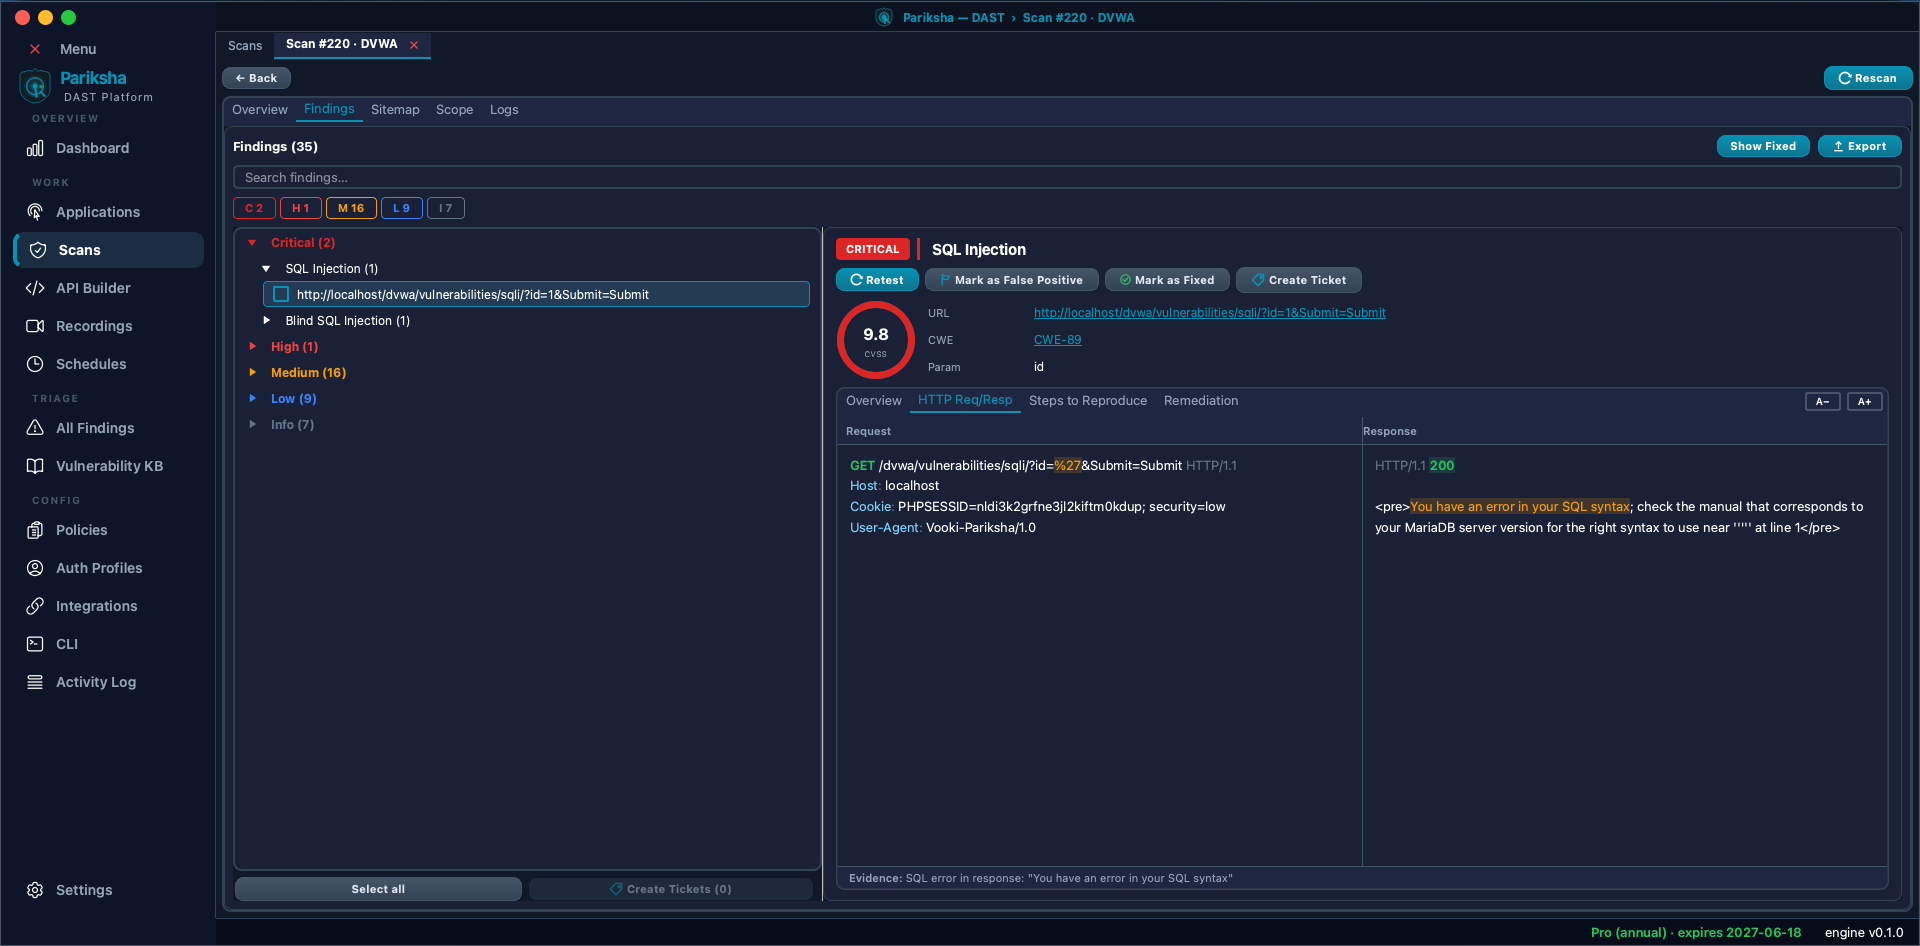
The left pane groups findings by severity, then by finding type with a count — for example
SQL Injection (1). A search box filters by text, and the severity chips
(C H M L I) filter by level.
Show Fixed brings back items you have already closed out.
The detail pane
Selecting a finding shows its severity, name and the headline facts:
- CVSS — the score, shown as a gauge.
- CWE — the weakness identifier, linked to its definition (e.g.
CWE-89for SQL injection). - URL and Param — exactly where it was found and which parameter carried the payload.
Four tabs carry the evidence:
- Overview — what the issue is, why it matters, severity and confidence.
- HTTP Req/Resp — the exact request and response, side by side and syntax-highlighted. The injected payload is marked in the request and the matching evidence is marked in the response, so you can see the proof rather than take the scanner's word for it. An Evidence line at the bottom states what matched, e.g. SQL error in response: "You have an error in your SQL syntax".
- Steps to Reproduce — the sequence to reproduce it by hand.
- Remediation — the fix, concrete steps and references.
The A- / A+ buttons adjust text size in the evidence panes.
Triage actions
Four actions sit above the detail pane:
- Retest — re-run the detector that raised this finding (see below).
- Mark as False Positive — for something that is not really exploitable in your context.
- Mark as Fixed — for something you have remediated.
- Create Ticket — push it into Jira, GitHub Issues, Linear, GitLab or Azure DevOps with its evidence and remediation attached. See Integrations.
False-positive and fixed states persist across future scans and carry into reports and exports, so you are not re-triaging the same item every week. Both collapse into their own groups, keeping the active list honest.
For bulk work, Select all and Create Tickets at the bottom raise tickets for many findings at once.
Automated retest
When a developer says it is fixed, Retest re-runs the same automated detector that raised the finding and reports a verdict with the fresh response attached. You do not hand-craft or replay anything — the check that found it is the check that confirms it, which is what makes the verdict trustworthy.
| Verdict | Meaning |
|---|---|
| Still Vulnerable | The detector fired again. The issue is still live. |
| Fixed | The detector no longer fires. Vooki Pro offers to mark the finding fixed. |
| Needs Manual Review | The result was ambiguous — check it by hand. |
All Findings — across every scan
The All Findings screen in the sidebar is the same detail pane over your whole history rather than one run. Filter by severity, finding type and originating scan, and search across the set. Use it to answer "does this issue appear anywhere else?" instead of opening scans one by one.
Findings that apply host-wide, origin-wide or policy-wide — a missing security header, a cookie flag, a weak TLS configuration — are consolidated rather than repeated once per URL, so a single misconfiguration does not appear 400 times.
Compliance tags
Each finding carries the control references it maps to, drawn from the knowledge base: OWASP Top 10 2021, PCI DSS v4, NIST 800-53, CIS Controls v8, ISO 27001, HIPAA and GDPR. These are what the compliance reports are built from.
Vulnerability KB
The Vulnerability KB screen is a read-only reference catalogue of 358 entries across 27 categories — what each finding type means, its severity, how to fix it and which controls it maps to. It is browsable at any time, not only when a scan raises something, which makes it useful for triage training and for answering an auditor's "what does this check actually do?"
Exporting results
Export on the Findings tab produces a report from the current scan. Standard
reports come as HTML, PDF, Word (DOCX) or JSON; compliance reports (HTML or PDF) map the same findings control by
control across seven frameworks; and a .vpscan archive carries the entire run —
findings, HTTP transactions, evidence anchors and triage states — to another Vooki Pro install.
Full detail in Reports &
Compliance.