Quick Start
This page takes you from a fresh install to a finished report. It should take about ten minutes, most of which is the scan running in the background while you get on with something else.
A Quick Tour
Vooki Pro groups everything in a sidebar that follows the order you actually work in — define an application, scan it, look at the results, then configure:
- Overview — Dashboard: severity KPIs, a risk trend chart and the most recent findings.
- Work — Applications, Scans, API Builder, Recordings, Schedules.
- Triage — All Findings across every scan, and the Vulnerability KB reference.
- Config — Policies, Auth Profiles, Integrations, CLI, Activity Log.
- Settings is pinned at the bottom, next to the light/dark theme toggle.
Your First Scan
The short version is below. For the complete walkthrough of every wizard step and every option in it, see How to Run a Web Application Scan.
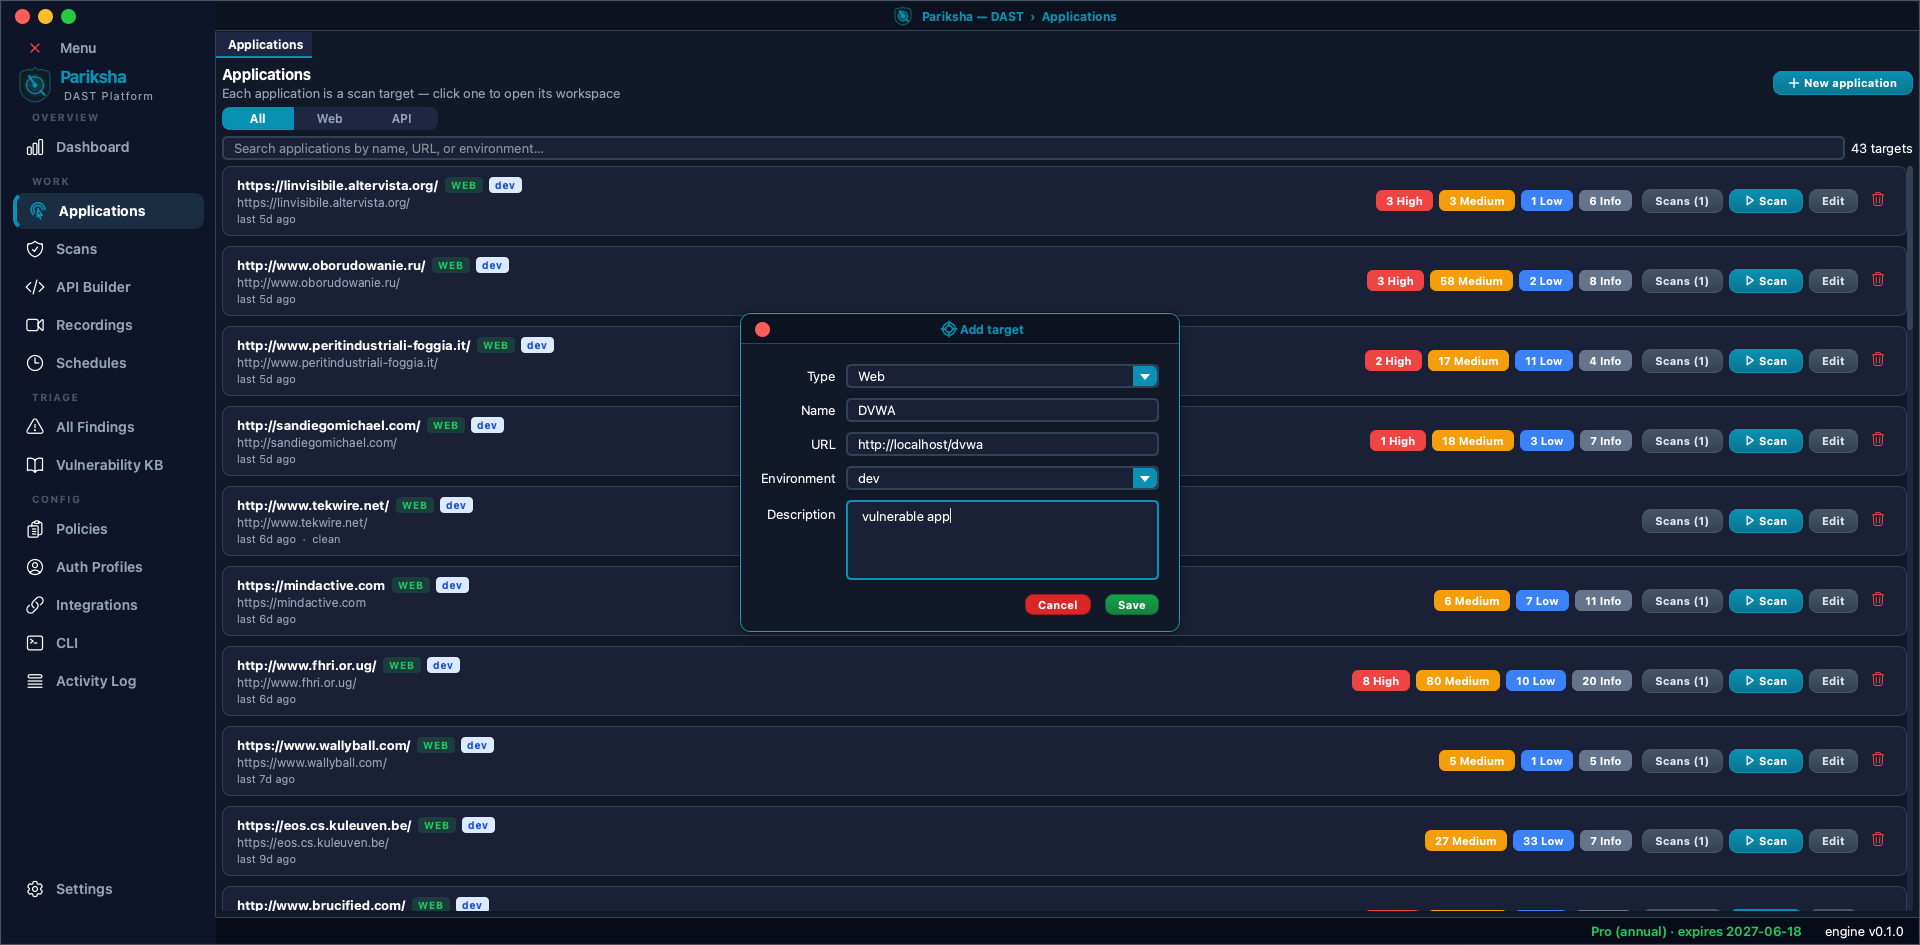
- Open Applications and click New application. Choose type
Web, give it a name, enter the base URL — for example
https://staging.example.com— pick an environment, and save. - Click Scan on the new row. The six-step wizard opens as its own tab.
- Target — your application is already selected. Leave host scope on Same Host.
- Discovery — choose Crawl website with a depth of 2 to start. Leave Discover background / API requests ticked so the scanner also sees your XHR endpoints.
- Auth — skip it for a first run, or paste a session cookie if the interesting parts of the app are behind a login.
- Policy — choose Standard. It covers the OWASP Top 10 essentials without the long tail that makes a Default scan slow.
- Schedule — leave it on Run now.
- Review — check the summary and click Launch scan.
Only scan applications you own or have written permission to test. An active DAST scan sends real attack payloads and can create data, trigger emails, or trip rate limits and WAF rules. Use a staging environment for the first run of any new policy.
Watching the Scan
The scan runs in the background — you can keep using the rest of the application. On the Scans screen each run is a card showing live progress and a severity histogram that fills in as findings arrive. Click a card to open the scan in its own tab with Overview, Findings, Sitemap, Scope and Logs tabs; reports are produced from the Export menu in the same view.
Scan duration depends on how much the crawler discovers and which policy you picked. A Quick policy on a small site finishes in minutes; a Deep policy on a large application can run for hours. Use the speed controls on the Policy step to throttle if you are scanning something fragile.
Reviewing Findings
- Open the scan and switch to the Findings tab. Issues are grouped by severity — Critical, High, Medium, Low and Info.
- Select any finding to see what it is, why it matters, the CVSS score and CWE reference, and the exact request and response that proved it.
- Wrong call? Click Mark as False Positive and it moves out of the active list into its own group, without being deleted.
- Fixed already? Click Mark as Fixed, or use Retest to re-run the exact detector that raised it and get a verdict from the live application.
Exporting a Report
- Open the scan and use the Export menu.
- Pick HTML, PDF, Word (DOCX) or JSON for a standard technical report.
- Or choose a compliance report and the framework you are being assessed against — OWASP, PCI DSS, NIST, ISO 27001, HIPAA, GDPR or SOX.
- Choose where to save it. That file is yours to send on — it is fully self-contained.
Next Steps
- Scanning something behind a login? See Auth Profiles and Browser Recordings.
- Have an API instead of a website? See REST API Scanner.
- Want this to run every night? See Scheduled Scans.
- Want it in your pipeline? See CLI & CI/CD.